Circle Diagrams,Chart PowerPoint Presentation Template,Statistic Infographic Slides,Business Cycle Process,Canva Corporate Graph Design

$ 20,00

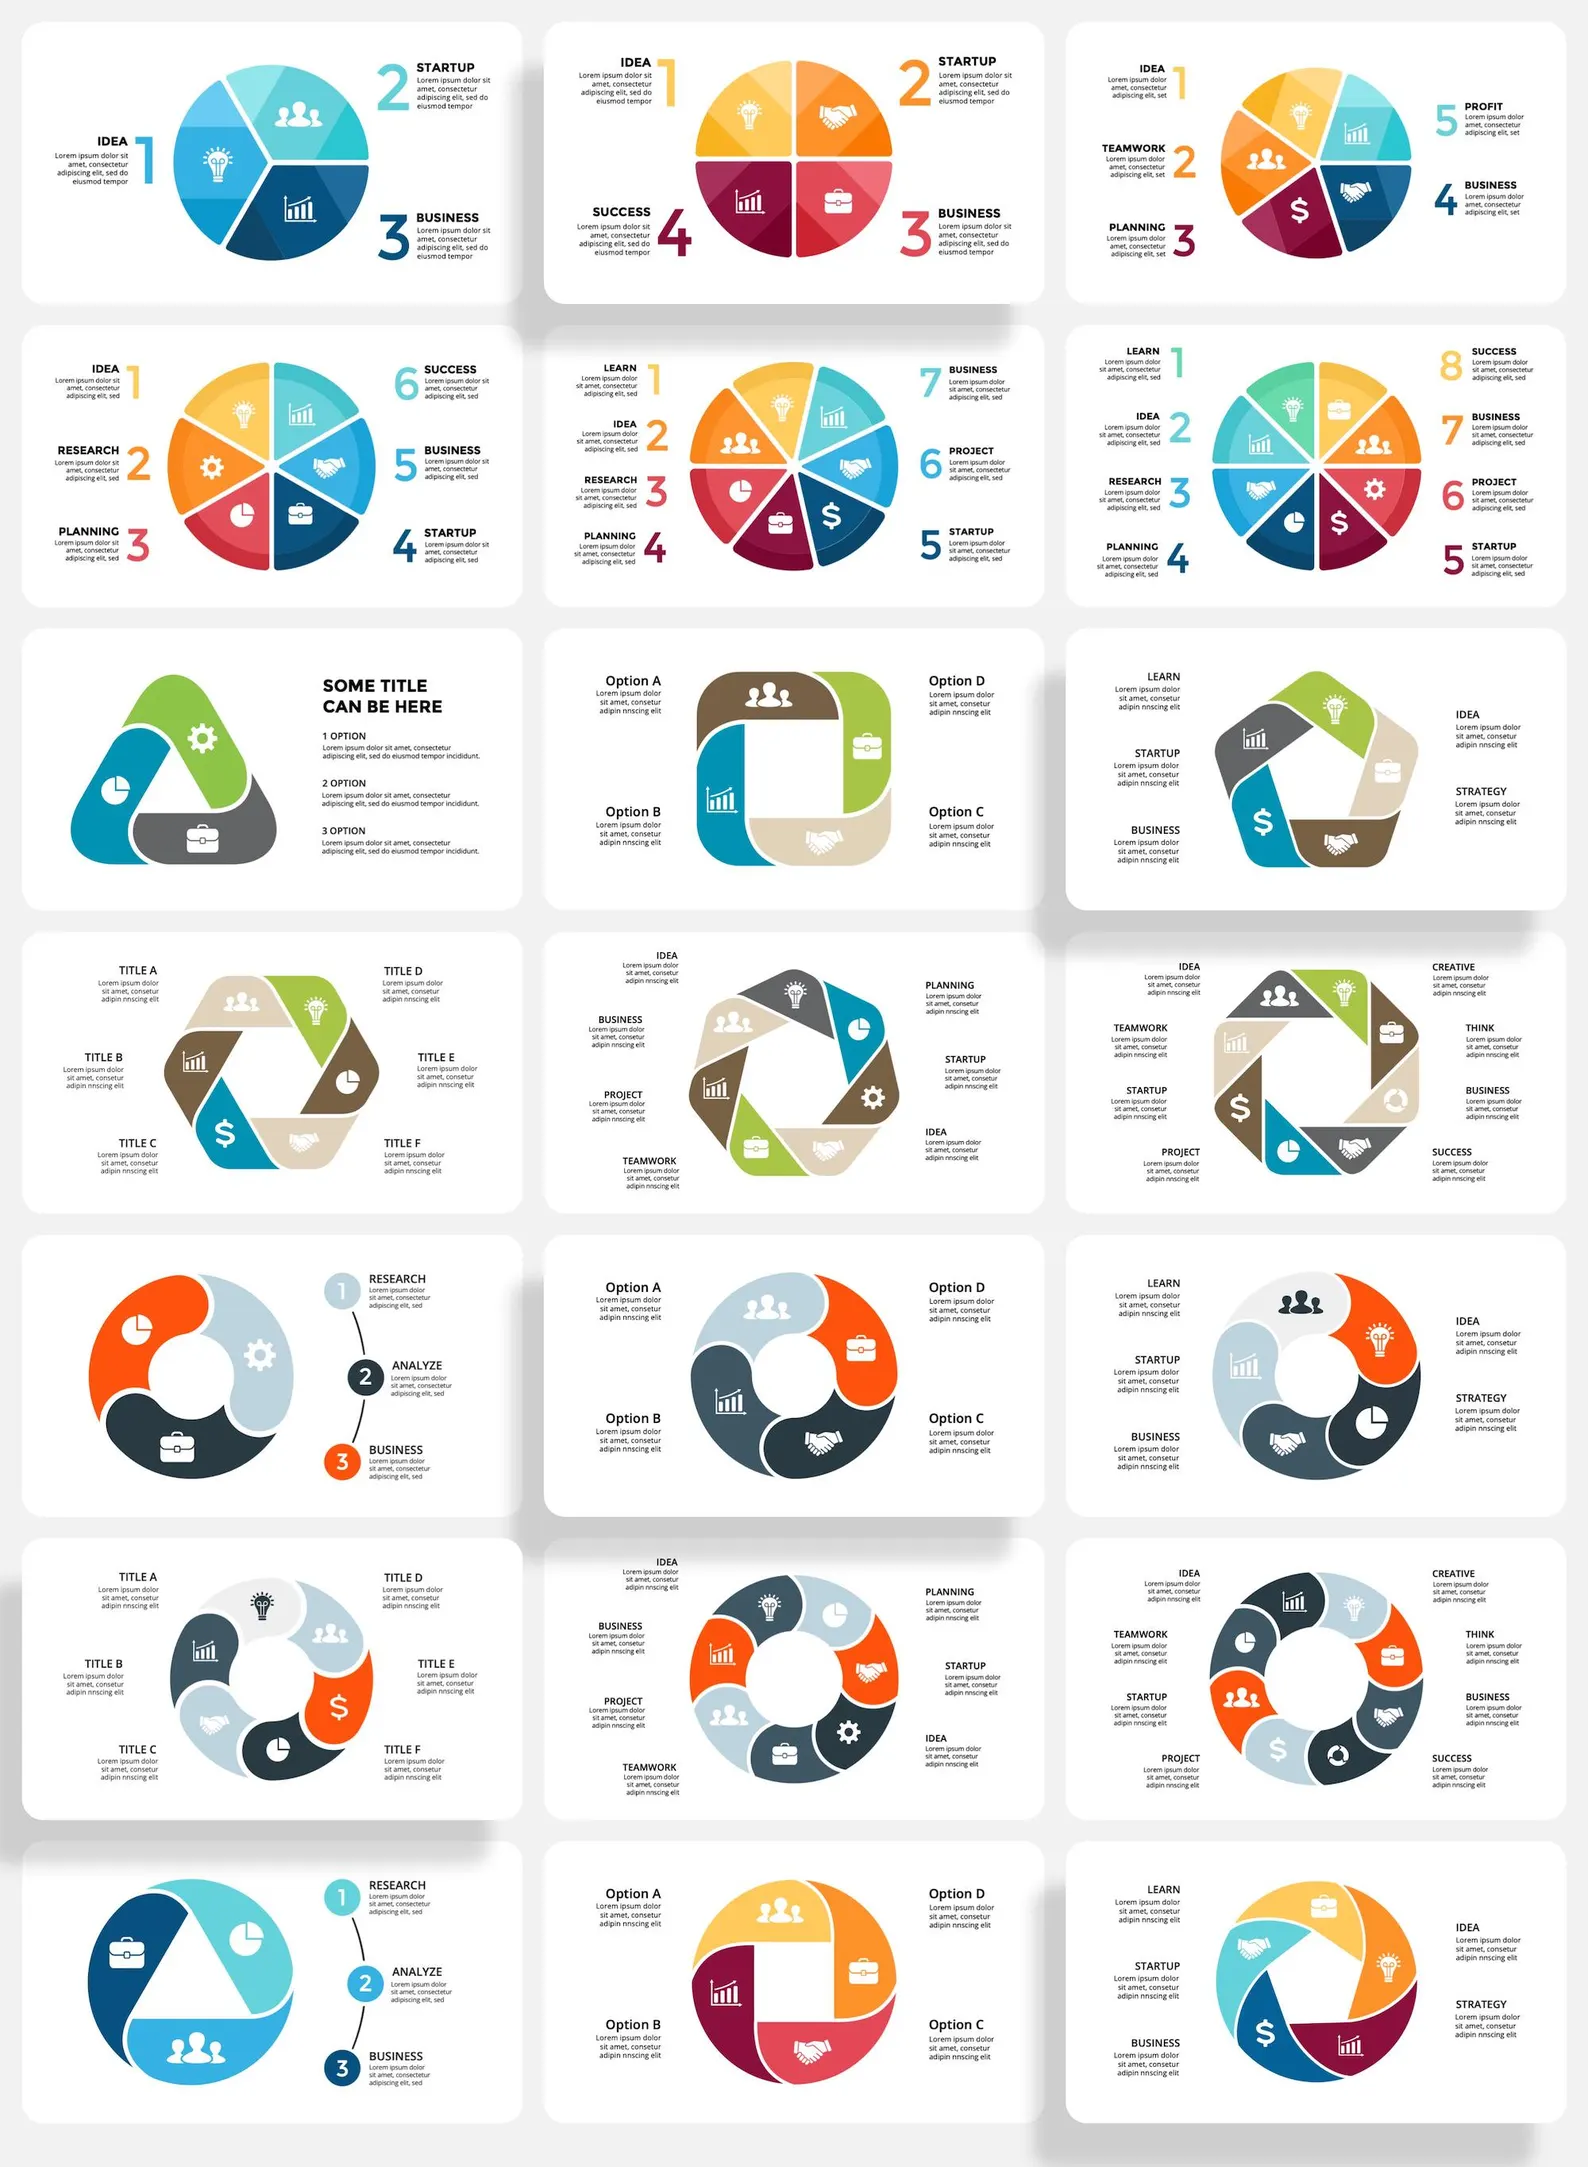
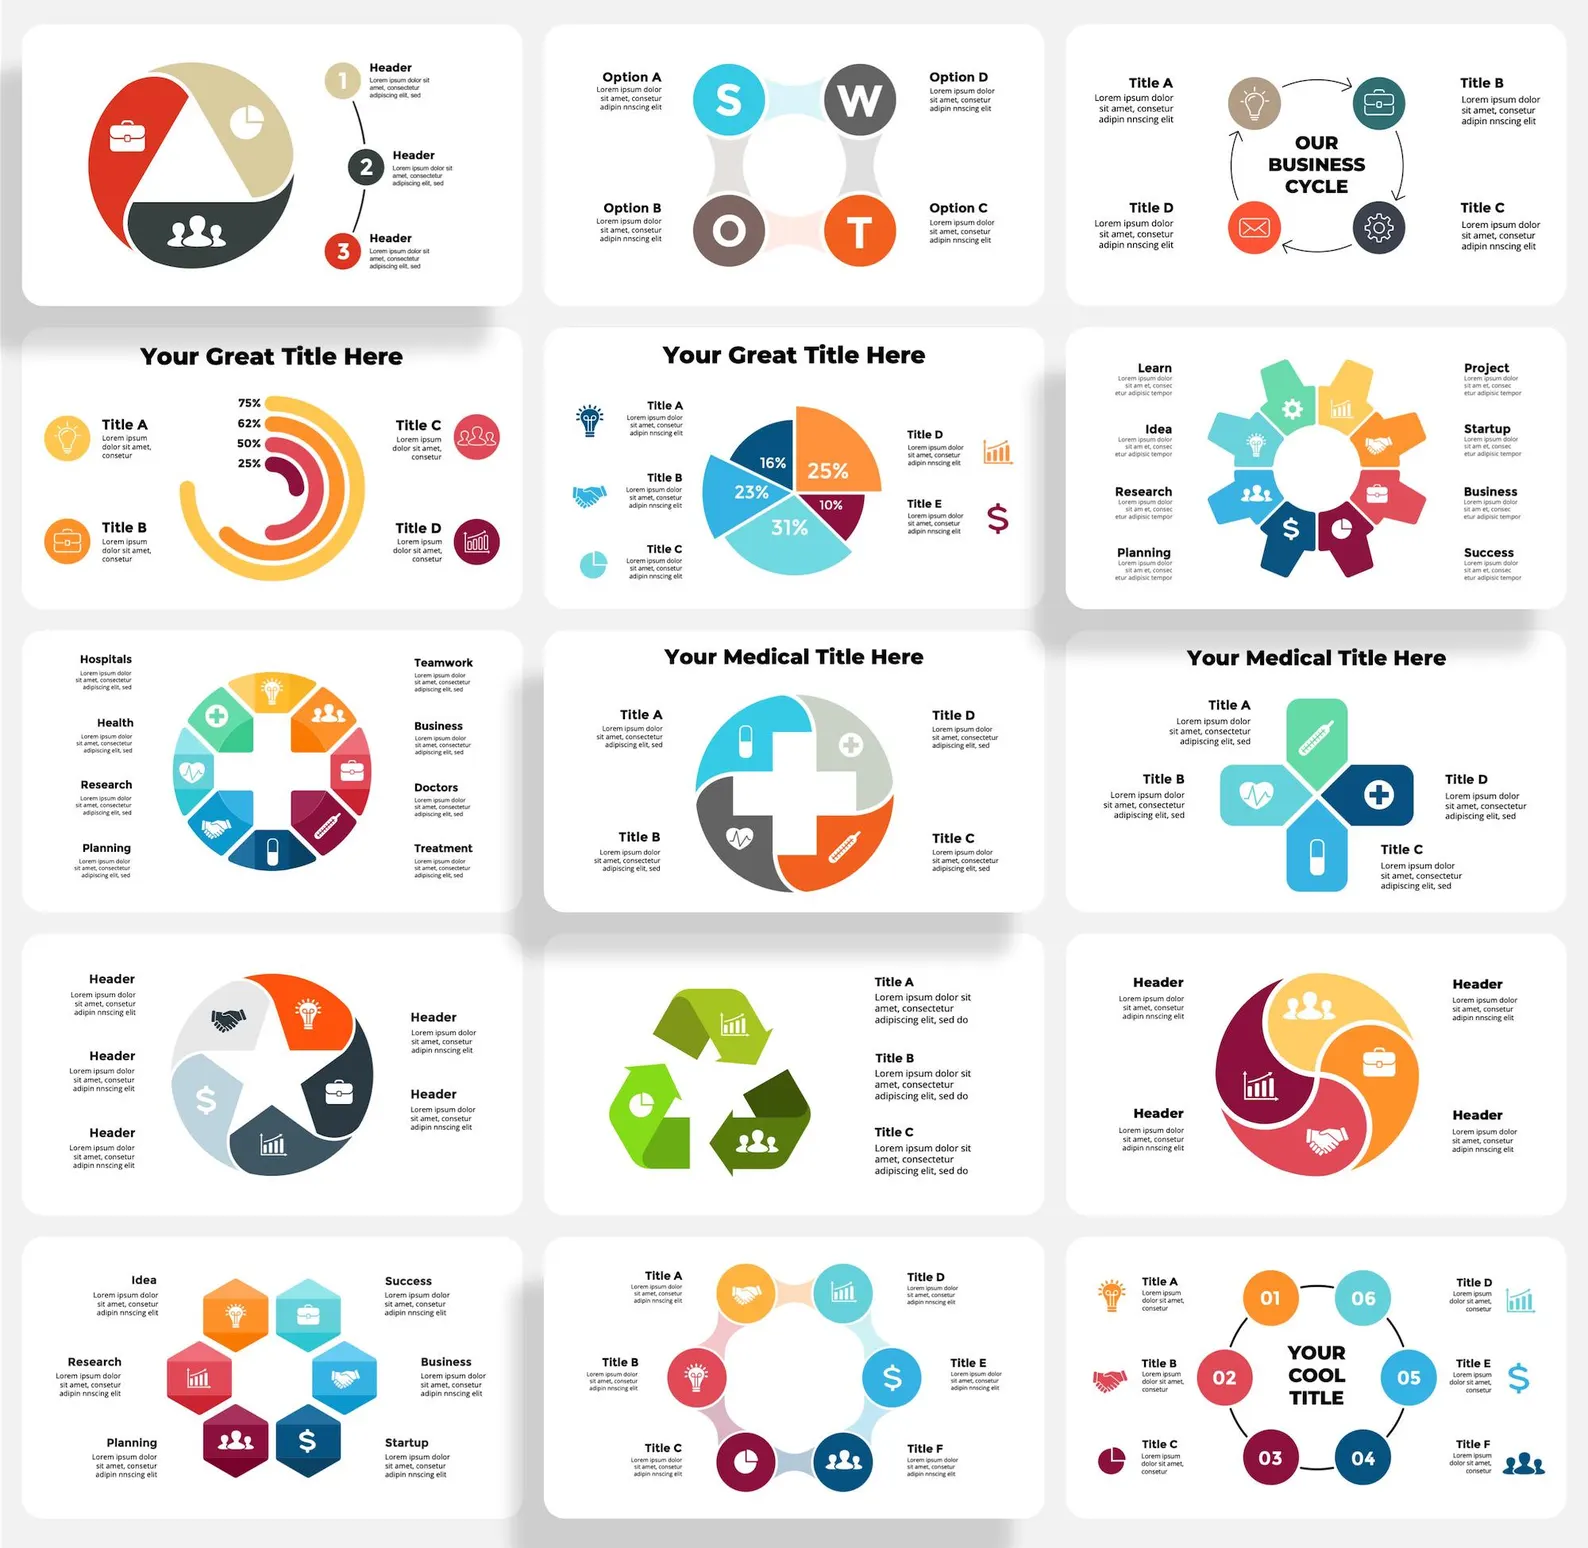
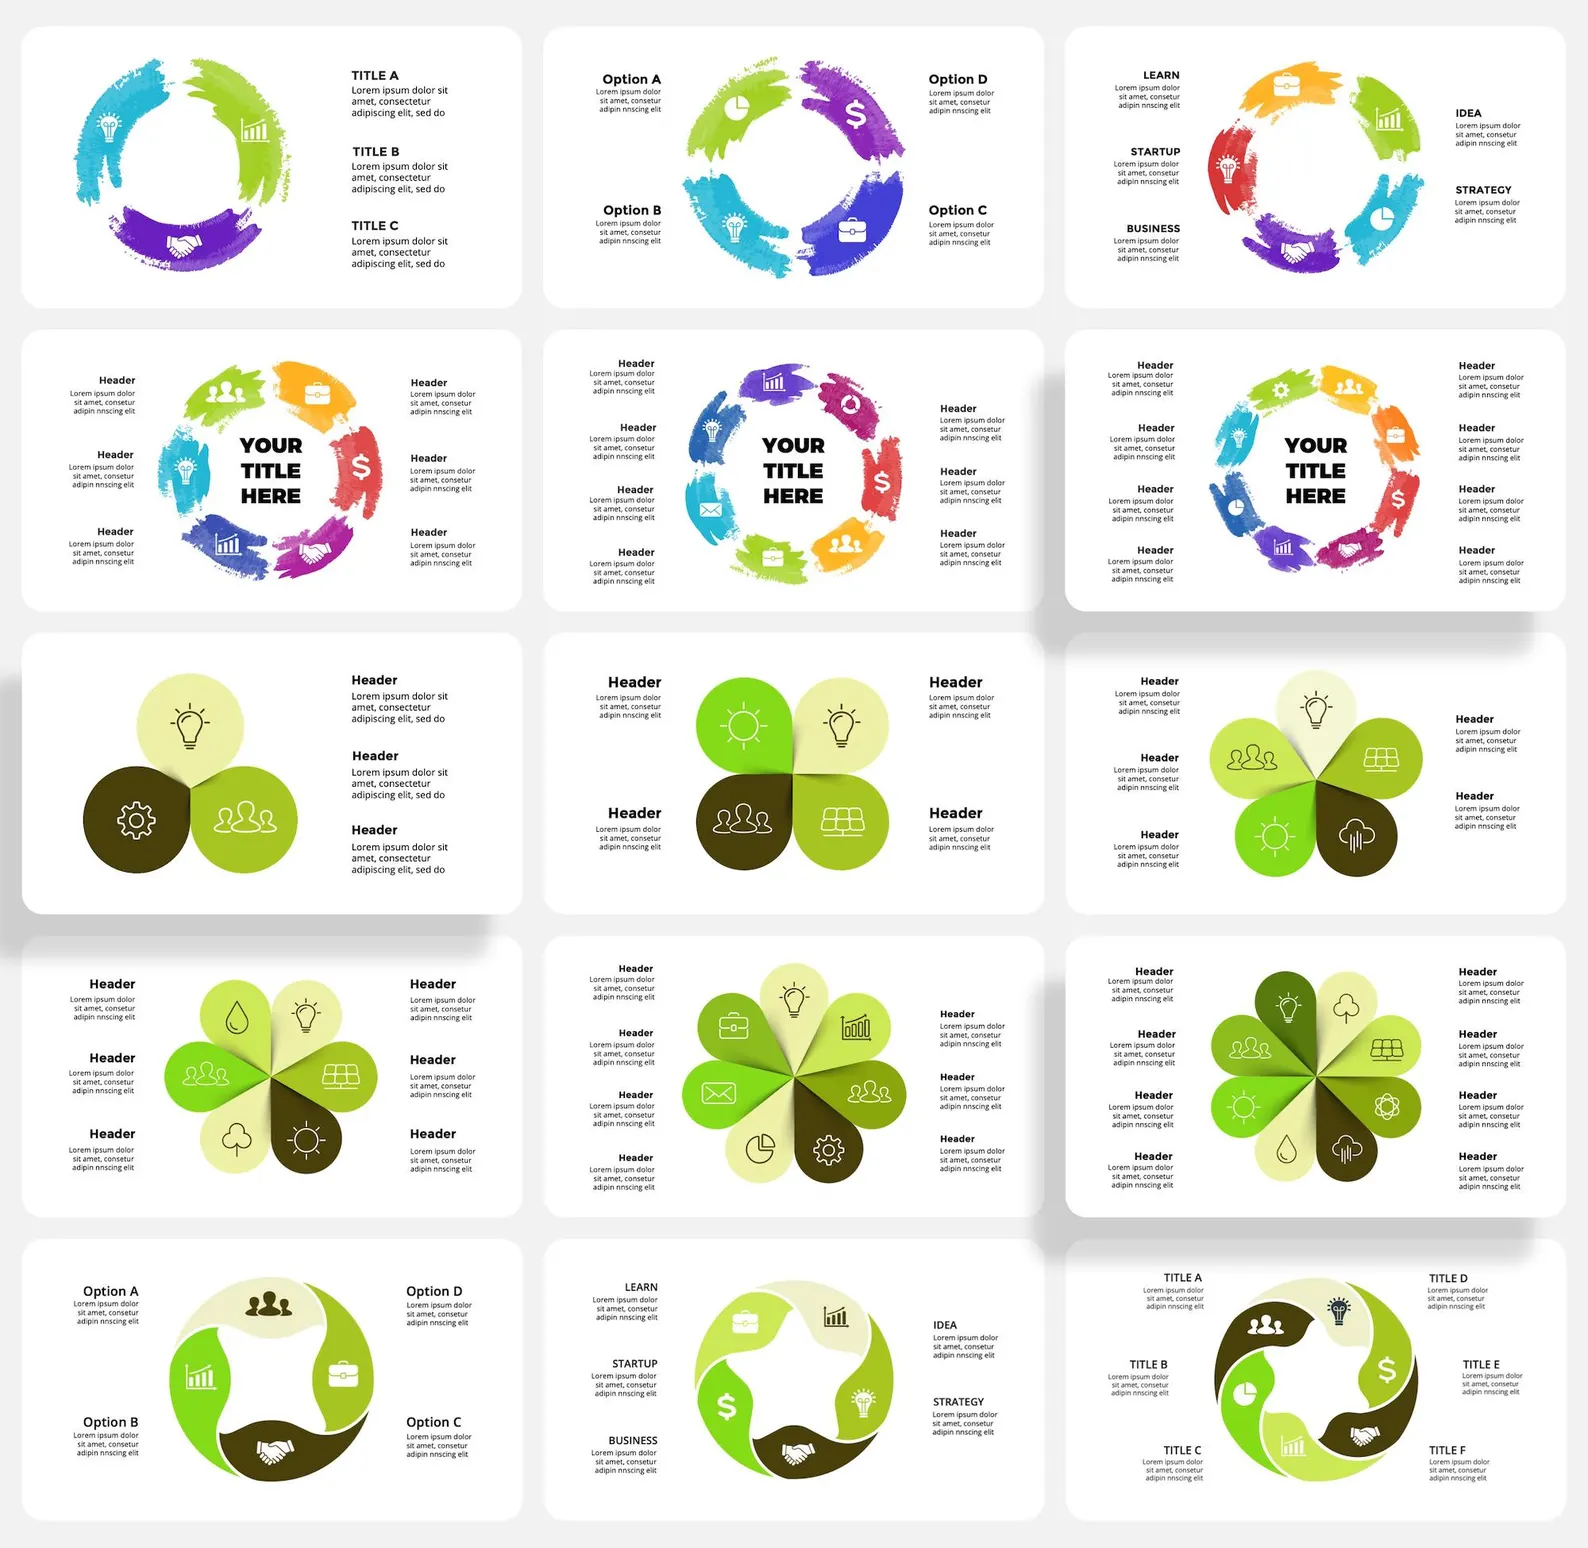
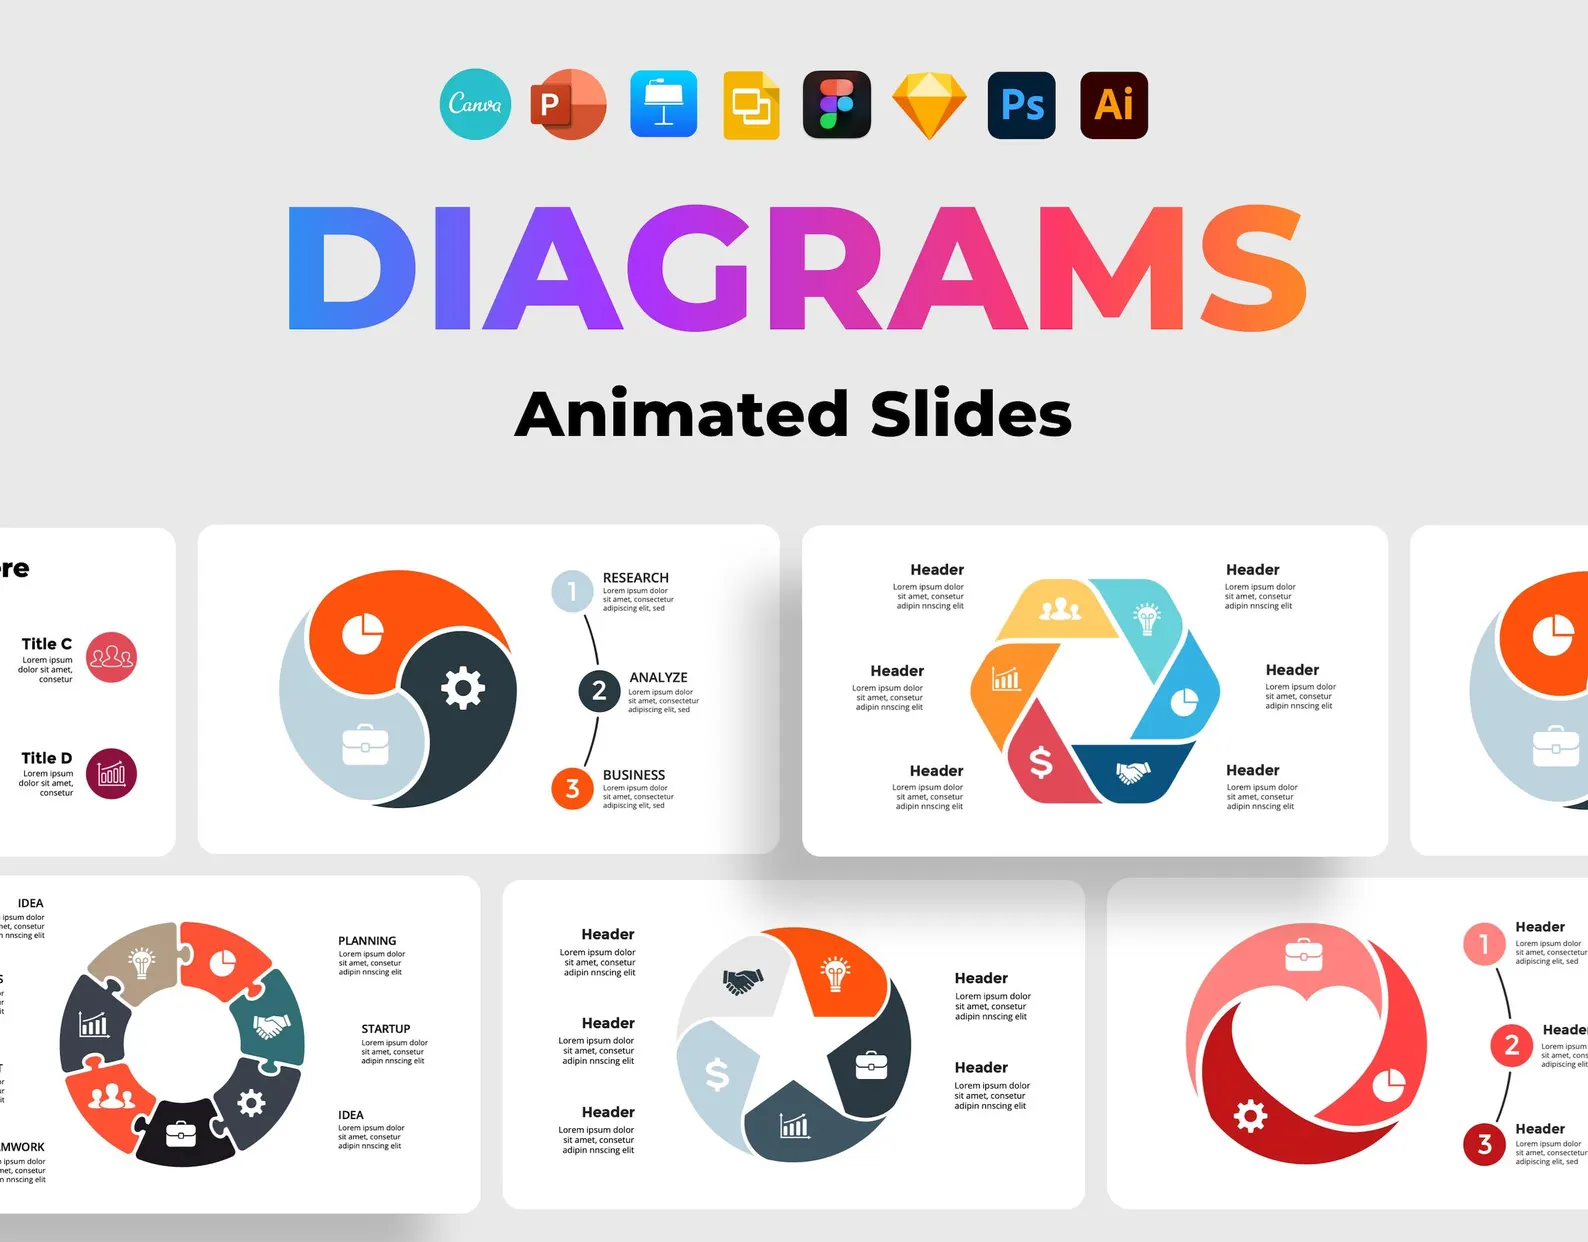
Visualize your data with clarity using the Circle Diagram Infographics Pack. This pack includes 154 unique animated slides featuring professional infographic elements like circle diagrams, circular charts, business cycle steps, and process visualizations, perfect for illustrating complex data in a simple and engaging way.

The templates are customizable in PowerPoint, Keynote, Google Slides, Canva, Figma, Sketch, PSD, and AI, offering versatility and ease of use.

Key Features:

  • 154 unique slides
  • Free updates
  • Fully animated slides
  • Free icons pack
  • Vector-based objects
  • Editable text and fonts (free download links provided)
  • 16×9 aspect ratio
  • Quick customer support

Description

Visualize your data with clarity using the Circle Diagram Infographics Pack. This pack includes 154 unique animated slides featuring professional infographic elements like circle diagrams, circular charts, business cycle steps, and process visualizations, perfect for illustrating complex data in a simple and engaging way.

The templates are customizable in PowerPoint, Keynote, Google Slides, Canva, Figma, Sketch, PSD, and AI, offering versatility and ease of use.

Key Features:

  • 154 unique slides
  • Free updates
  • Fully animated slides
  • Free icons pack
  • Vector-based objects
  • Editable text and fonts (free download links provided)
  • 16×9 aspect ratio
  • Quick customer support

Impress your audience and enhance your presentations with the Circle Diagram Infographics Pack, the perfect solution for data visualization and process illustration!

Reviews

There are no reviews yet.

Be the first to review “Circle Diagrams,Chart PowerPoint Presentation Template,Statistic Infographic Slides,Business Cycle Process,Canva Corporate Graph Design”

Your email address will not be published. Required fields are marked *